Index Trend Analysis Report
Prepared for you on Sunday, March 22, 2026.
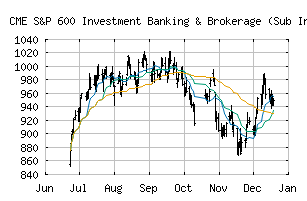
S&P 600 Investment Banking & Brokerage (Sub Ind) (CME:SP600-40203020)
Strong Downtrend (-100) - SP600-40203020 is in a strong downtrend that is likely to continue. With short-term, intermediate, and long-term bearish momentum, SP600-40203020 continues to fall. Traders should use caution and set stops.
Is it time to buy, sell, or avoid SP600-40203020?
MarketClub looks at technical strength and momentum to determine if the timing is right for SP600-40203020.
Learn more about the Trade Triangles and how we make technical analysis as easy as buy and sell.
|
|||||||||||||||
|
|||||||||||||||
MarketClub’s Trade Triangles for SP600-40203020
![]() The long-term trend has been DOWN since Mar 6th, 2026 at 896.64
The long-term trend has been DOWN since Mar 6th, 2026 at 896.64
![]() The intermediate-term trend has been DOWN since Feb 3rd, 2026 at 969.31
The intermediate-term trend has been DOWN since Feb 3rd, 2026 at 969.31
![]() The short-term trend has been DOWN since Mar 19th, 2026 at 869.00
The short-term trend has been DOWN since Mar 19th, 2026 at 869.00
Smart Scan Analysis for SP600-40203020
Based on our trend formula, SP600-40203020 is rated as a -100 on a scale from -100 (Strong Downtrend) to +100 (Strong Uptrend).
| Open | High | Low | Price | Change |
|---|---|---|---|---|
| 880.65 | 887.74 | 873.20 | 882.51 | +4.57 |
| Prev. Close | Volume | Bid | Ask | Time |
| 882.51 | 13691712 | 2026-03-20 16:20:11 |
| 52wk High | 390.53 | 52wk High Date | 2018-08-09 |
| 52wk Low | 310.37 | 52wk Low Date | 2018-05-01 |