Index Trend Analysis Report
Prepared for you on Tuesday, April 14, 2026.
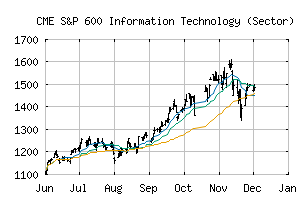
S&P 600 Information Technology (Sector) (CME:SP600-45)
Long-Term Uptrend (+90) - SP600-45 is in a strong uptrend that is likely to continue. While SP600-45 is showing intraday weakness, it remains in the confines of a bullish trend. Traders should use caution and utilize a stop order.
Is it time to buy, sell, or avoid SP600-45?
MarketClub looks at technical strength and momentum to determine if the timing is right for SP600-45.
Learn more about the Trade Triangles and how we make technical analysis as easy as buy and sell.
|
|||||||||||||||
|
|||||||||||||||
MarketClub’s Trade Triangles for SP600-45
![]() The long-term trend has been UP since Jun 9th, 2025 at 1171.71
The long-term trend has been UP since Jun 9th, 2025 at 1171.71
![]() The intermediate-term trend has been UP since Apr 8th, 2026 at 1659.61
The intermediate-term trend has been UP since Apr 8th, 2026 at 1659.61
![]() The short-term trend has been UP since Apr 1st, 2026 at 1585.53
The short-term trend has been UP since Apr 1st, 2026 at 1585.53
Smart Scan Analysis for SP600-45
Based on our trend formula, SP600-45 is rated as a +90 on a scale from -100 (Strong Downtrend) to +100 (Strong Uptrend).
| Open | High | Low | Price | Change |
|---|---|---|---|---|
| 1765.67 | 1769.33 | 1750.98 | 1753.28 | +7.73 |
| Prev. Close | Volume | Bid | Ask | Time |
| 1745.55 | 138840148 | 2026-04-14 16:17:19 |
| 52wk High | 785.11 | 52wk High Date | 2018-08-31 |
| 52wk Low | 622.59 | 52wk Low Date | 2018-02-09 |