Index Trend Analysis Report
Prepared for you on Wednesday, March 25, 2026.
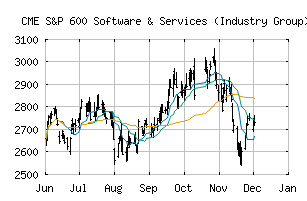
S&P 600 Software & Services (Industry Group) (CME:SP600-4510)
Weak Downtrend (-65) - SP600-4510 is showing signs of a strengthening downtrend. Monitor SP600-4510 as it may be building momentum to the downside.
Is it time to buy, sell, or avoid SP600-4510?
MarketClub looks at technical strength and momentum to determine if the timing is right for SP600-4510.
Learn more about the Trade Triangles and how we make technical analysis as easy as buy and sell.
|
|||||||||||||||
|
|||||||||||||||
MarketClub’s Trade Triangles for SP600-4510
![]() The long-term trend has been DOWN since Nov 20th, 2025 at 2546.43
The long-term trend has been DOWN since Nov 20th, 2025 at 2546.43
![]() The intermediate-term trend has been UP since Mar 4th, 2026 at 2565.39
The intermediate-term trend has been UP since Mar 4th, 2026 at 2565.39
![]() The short-term trend has been DOWN since Mar 25th, 2026 at 2476.66
The short-term trend has been DOWN since Mar 25th, 2026 at 2476.66
Smart Scan Analysis for SP600-4510
Based on our trend formula, SP600-4510 is rated as a -65 on a scale from -100 (Strong Downtrend) to +100 (Strong Uptrend).
| Open | High | Low | Price | Change |
|---|---|---|---|---|
| 2524.69 | 2540.13 | 2472.11 | 2506.84 | +9.65 |
| Prev. Close | Volume | Bid | Ask | Time |
| 2497.19 | 105455404 | 2026-03-25 16:19:26 |
| 52wk High | 2242.84 | 52wk High Date | 2018-09-04 |
| 52wk Low | 1664.92 | 52wk Low Date | 2018-02-09 |