Index Trend Analysis Report
Prepared for you on Wednesday, March 25, 2026.
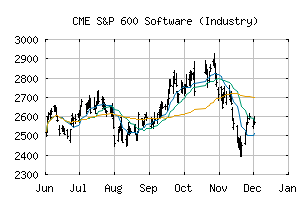
S&P 600 Software (Industry) (CME:SP600-451030)
Long-Term Downtrend (-90) - SP600-451030 is in a strong downtrend that is likely to continue. While SP600-451030 is showing intraday strength, it remains in the confines of a bearish trend. Traders should use caution and set stops.
Is it time to buy, sell, or avoid SP600-451030?
MarketClub looks at technical strength and momentum to determine if the timing is right for SP600-451030.
Learn more about the Trade Triangles and how we make technical analysis as easy as buy and sell.
|
|||||||||||||||
|
|||||||||||||||
MarketClub’s Trade Triangles for SP600-451030
![]() The long-term trend has been DOWN since Nov 18th, 2025 at 2446.32
The long-term trend has been DOWN since Nov 18th, 2025 at 2446.32
![]() The intermediate-term trend has been DOWN since Mar 25th, 2026 at 2213.35
The intermediate-term trend has been DOWN since Mar 25th, 2026 at 2213.35
![]() The short-term trend has been DOWN since Mar 25th, 2026 at 2213.35
The short-term trend has been DOWN since Mar 25th, 2026 at 2213.35
Smart Scan Analysis for SP600-451030
Based on our trend formula, SP600-451030 is rated as a -90 on a scale from -100 (Strong Downtrend) to +100 (Strong Uptrend).
| Open | High | Low | Price | Change |
|---|---|---|---|---|
| 2274.02 | 2288.11 | 2201.67 | 2226.41 | -1.03 |
| Prev. Close | Volume | Bid | Ask | Time |
| 2227.44 | 86011872 | 2026-03-25 16:19:26 |
| 52wk High | 2130.99 | 52wk High Date | 2018-09-13 |
| 52wk Low | 1566.86 | 52wk Low Date | 2018-11-20 |