Index Trend Analysis Report
Prepared for you on Monday, June 30, 2025.
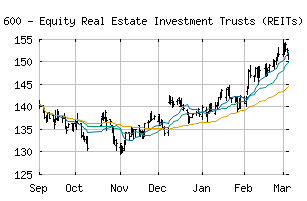
S&P 600 - Equity Real Estate Investment Trusts (REITs) (Industry) (CME:SP600-601010)
Long-Term Downtrend (-90) - SP600-601010 is in a strong downtrend that is likely to continue. While SP600-601010 is showing intraday strength, it remains in the confines of a bearish trend. Traders should use caution and set stops.
Is it time to buy, sell, or avoid SP600-601010?
MarketClub looks at technical strength and momentum to determine if the timing is right for SP600-601010.
Learn more about the Trade Triangles and how we make technical analysis as easy as buy and sell.
|
|||||||||||||||
|
|||||||||||||||
MarketClub’s Trade Triangles for SP600-601010
![]() The long-term trend has been DOWN since Dec 18th, 2024 at 148.16
The long-term trend has been DOWN since Dec 18th, 2024 at 148.16
![]() The intermediate-term trend has been DOWN since Jun 17th, 2025 at 139.24
The intermediate-term trend has been DOWN since Jun 17th, 2025 at 139.24
![]() The short-term trend has been DOWN since Jun 25th, 2025 at 140.90
The short-term trend has been DOWN since Jun 25th, 2025 at 140.90
Smart Scan Analysis for SP600-601010
Based on our trend formula, SP600-601010 is rated as a -90 on a scale from -100 (Strong Downtrend) to +100 (Strong Uptrend).
| Open | High | Low | Price | Change |
|---|---|---|---|---|
| 139.79 | 139.81 | 136.96 | 139.52 | -0.19 |
| Prev. Close | Volume | Bid | Ask | Time |
| 139.71 | 6563768 | 2025-06-30 16:20:09 |
| 52wk High | 226.36 | 52wk High Date | 2017-12-06 |
| 52wk Low | 170.06 | 52wk Low Date | 2018-03-23 |