Index Trend Analysis Report
Prepared for you on Saturday, May 18, 2024.
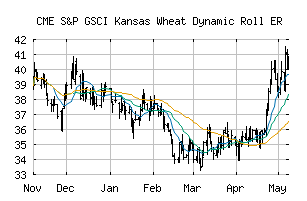
S&P GSCI Kansas Wheat Dynamic Roll ER (CME:SPDYKWP)
Countertrend Up (+85) - SPDYKWP is showing short-term weakness. However, look for the longer-term bullish trend to resume. As always, continue to monitor the trend score and utilize a stop order.
Is it time to buy, sell, or avoid SPDYKWP?
MarketClub looks at technical strength and momentum to determine if the timing is right for SPDYKWP.
Learn more about the Trade Triangles and how we make technical analysis as easy as buy and sell.
|
|||||||||||||||
|
|||||||||||||||
MarketClub’s Trade Triangles for SPDYKWP
![]() The long-term trend has been UP since Apr 24th, 2024 at 38.730
The long-term trend has been UP since Apr 24th, 2024 at 38.730
![]() The intermediate-term trend has been UP since Apr 22nd, 2024 at 36.209
The intermediate-term trend has been UP since Apr 22nd, 2024 at 36.209
![]() The short-term trend has been DOWN since May 17th, 2024 at 41.074
The short-term trend has been DOWN since May 17th, 2024 at 41.074
Smart Scan Analysis for SPDYKWP
Based on our trend formula, SPDYKWP is rated as a +85 on a scale from -100 (Strong Downtrend) to +100 (Strong Uptrend).
| Open | High | Low | Price | Change |
|---|---|---|---|---|
| 41.319 | 41.946 | 40.401 | 40.493 | -0.826 |
| Prev. Close | Volume | Bid | Ask | Time |
| 40.493 | 0 | 2024-05-17 15:44:02 |