Index Trend Analysis Report
Prepared for you on Saturday, May 18, 2024.
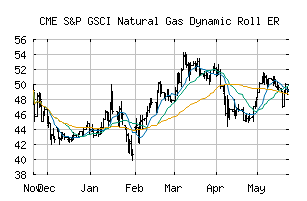
S&P GSCI Natural Gas Dynamic Roll ER (CME:SPDYNGP)
Weak Downtrend (-65) - SPDYNGP is showing signs of a strengthening downtrend. Monitor SPDYNGP as it may be building momentum to the downside.
Is it time to buy, sell, or avoid SPDYNGP?
MarketClub looks at technical strength and momentum to determine if the timing is right for SPDYNGP.
Learn more about the Trade Triangles and how we make technical analysis as easy as buy and sell.
|
|||||||||||||||
|
|||||||||||||||
MarketClub’s Trade Triangles for SPDYNGP
![]() The long-term trend has been DOWN since Dec 20th, 2022 at 158.970
The long-term trend has been DOWN since Dec 20th, 2022 at 158.970
![]() The intermediate-term trend has been DOWN since May 9th, 2024 at 50.478
The intermediate-term trend has been DOWN since May 9th, 2024 at 50.478
![]() The short-term trend has been UP since May 14th, 2024 at 50.716
The short-term trend has been UP since May 14th, 2024 at 50.716
Smart Scan Analysis for SPDYNGP
Based on our trend formula, SPDYNGP is rated as a -65 on a scale from -100 (Strong Downtrend) to +100 (Strong Uptrend).
-65
Strong Downtrend
Sideways
Strong Uptrend
| Open | High | Low | Price | Change |
|---|---|---|---|---|
| 52.177 | 52.907 | 52.145 | 52.256 | +0.079 |
| Prev. Close | Volume | Bid | Ask | Time |
| 52.256 | 0 | 2024-05-17 15:44:01 |
| 52wk High | 90.0159 | 52wk High Date | 2018-11-19 |
| 52wk Low | 72.0656 | 52wk Low Date | 2017-12-21 |
Get a free daily analysis and signals for S&P GSCI Natural Gas Dynamic Roll ER (SPDYNGP) - Request Your Free Report.