Index Trend Analysis Report
Prepared for you on Friday, April 19, 2024.
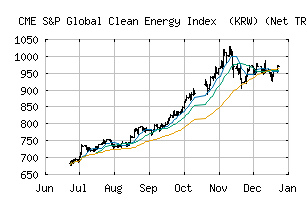
S&P Global Clean Energy Index (KRW) (Net TR) (CME:SPGTCEKN)
Strong Downtrend (-100) - SPGTCEKN is in a strong downtrend that is likely to continue. With short-term, intermediate, and long-term bearish momentum, SPGTCEKN continues to fall. Traders should use caution and set stops.
Is it time to buy, sell, or avoid SPGTCEKN?
MarketClub looks at technical strength and momentum to determine if the timing is right for SPGTCEKN.
Learn more about the Trade Triangles and how we make technical analysis as easy as buy and sell.
|
|||||||||||||||
|
|||||||||||||||
MarketClub’s Trade Triangles for SPGTCEKN
![]() The long-term trend has been DOWN since Mar 14th, 2024 at 681.04
The long-term trend has been DOWN since Mar 14th, 2024 at 681.04
![]() The intermediate-term trend has been DOWN since Apr 16th, 2024 at 689.36
The intermediate-term trend has been DOWN since Apr 16th, 2024 at 689.36
![]() The short-term trend has been DOWN since Apr 15th, 2024 at 714.63
The short-term trend has been DOWN since Apr 15th, 2024 at 714.63
Smart Scan Analysis for SPGTCEKN
Based on our trend formula, SPGTCEKN is rated as a -100 on a scale from -100 (Strong Downtrend) to +100 (Strong Uptrend).
| Open | High | Low | Price | Change |
|---|---|---|---|---|
| 688.48 | 688.63 | 682.87 | 683.20 | -5.38 |
| Prev. Close | Volume | Bid | Ask | Time |
| 688.58 | 0 | 2024-04-19 09:26:00 |