Index Trend Analysis Report
Prepared for you on Saturday, May 18, 2024.
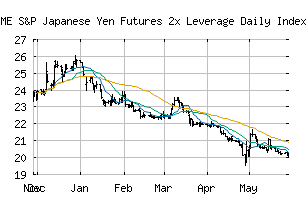
S&P Japanese Yen Futures 2x Leverage Daily Index TR (CME:SPJYFT2L)
Countertrend Down (-85) - SPJYFT2L is showing short-term strength. However, look for the longer-term bearish trend to resume. As always, continue to monitor the trend score and set stops.
Is it time to buy, sell, or avoid SPJYFT2L?
MarketClub looks at technical strength and momentum to determine if the timing is right for SPJYFT2L.
Learn more about the Trade Triangles and how we make technical analysis as easy as buy and sell.
|
|||||||||||||||
|
|||||||||||||||
MarketClub’s Trade Triangles for SPJYFT2L
![]() The long-term trend has been DOWN since Feb 13th, 2024 at 22.450
The long-term trend has been DOWN since Feb 13th, 2024 at 22.450
![]() The intermediate-term trend has been DOWN since Mar 19th, 2024 at 22.273
The intermediate-term trend has been DOWN since Mar 19th, 2024 at 22.273
![]() The short-term trend has been UP since May 15th, 2024 at 20.642
The short-term trend has been UP since May 15th, 2024 at 20.642
Smart Scan Analysis for SPJYFT2L
Based on our trend formula, SPJYFT2L is rated as a -85 on a scale from -100 (Strong Downtrend) to +100 (Strong Uptrend).
| Open | High | Low | Price | Change |
|---|---|---|---|---|
| 20.543 | 20.707 | 20.511 | 20.591 | +0.048 |
| Prev. Close | Volume | Bid | Ask | Time |
| 20.591 | 0 | 2024-05-17 15:09:55 |