Index Trend Analysis Report
Prepared for you on Saturday, February 28, 2026.
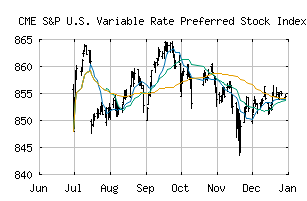
S&P U.S. Variable Rate Preferred Stock Index (CME:SPPREVR)
Weak Uptrend (+65) - SPPREVR is showing signs of weakening momentum to the upside. Monitor SPPREVR as it may be in the beginning stages of a reversal.
Is it time to buy, sell, or avoid SPPREVR?
MarketClub looks at technical strength and momentum to determine if the timing is right for SPPREVR.
Learn more about the Trade Triangles and how we make technical analysis as easy as buy and sell.
|
|||||||||||||||
|
|||||||||||||||
MarketClub’s Trade Triangles for SPPREVR
![]() The long-term trend has been UP since Jan 15th, 2026 at 860.60
The long-term trend has been UP since Jan 15th, 2026 at 860.60
![]() The intermediate-term trend has been UP since Feb 18th, 2026 at 863.29
The intermediate-term trend has been UP since Feb 18th, 2026 at 863.29
![]() The short-term trend has been DOWN since Feb 23rd, 2026 at 860.25
The short-term trend has been DOWN since Feb 23rd, 2026 at 860.25
Smart Scan Analysis for SPPREVR
Based on our trend formula, SPPREVR is rated as a +65 on a scale from -100 (Strong Downtrend) to +100 (Strong Uptrend).
| Open | High | Low | Price | Change |
|---|---|---|---|---|
| 858.50 | 858.69 | 854.74 | 857.85 | -1.14 |
| Prev. Close | Volume | Bid | Ask | Time |
| 857.85 | 0 | 2026-02-27 16:19:59 |
| 52wk High | 949.02 | 52wk High Date | 2017-12-08 |
| 52wk Low | 866.03 | 52wk Low Date | 2018-11-29 |