Index Trend Analysis Report
Prepared for you on Sunday, March 15, 2026.
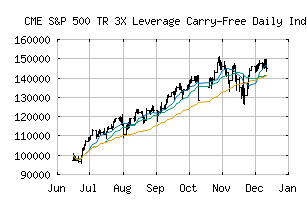
S&P 500 TR 3X Leverage Carry-Free Daily Index (CME:SPX3LCUT)
Strong Downtrend (-100) - SPX3LCUT is in a strong downtrend that is likely to continue. With short-term, intermediate, and long-term bearish momentum, SPX3LCUT continues to fall. Traders should use caution and set stops.
Is it time to buy, sell, or avoid SPX3LCUT?
MarketClub looks at technical strength and momentum to determine if the timing is right for SPX3LCUT.
Learn more about the Trade Triangles and how we make technical analysis as easy as buy and sell.
|
|||||||||||||||
|
|||||||||||||||
MarketClub’s Trade Triangles for SPX3LCUT
![]() The long-term trend has been DOWN since Mar 3rd, 2026 at 138296.02
The long-term trend has been DOWN since Mar 3rd, 2026 at 138296.02
![]() The intermediate-term trend has been DOWN since Feb 5th, 2026 at 142545.32
The intermediate-term trend has been DOWN since Feb 5th, 2026 at 142545.32
![]() The short-term trend has been DOWN since Mar 2nd, 2026 at 145118.66
The short-term trend has been DOWN since Mar 2nd, 2026 at 145118.66
Smart Scan Analysis for SPX3LCUT
Based on our trend formula, SPX3LCUT is rated as a -100 on a scale from -100 (Strong Downtrend) to +100 (Strong Uptrend).
| Open | High | Low | Price | Change |
|---|---|---|---|---|
| 135215.72 | 138943.09 | 132313.03 | 132811.48 | -2404.24 |
| Prev. Close | Volume | Bid | Ask | Time |
| 132811.48 | 0 | 2026-03-13 17:01:53 |