Stock Trend Analysis Report
Prepared for you on Saturday, April 11, 2026.
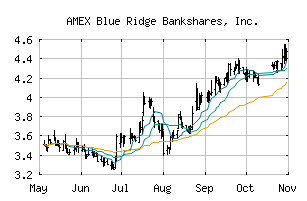
Blue Ridge Bankshares, Inc. (AMEX:BRBS)
Crossroads (+60) - BRBS is struggling to move into a solid trend. Beware of choppy markets and consider a sidelines position until a stronger trend is identified.
Is it time to buy, sell, or avoid BRBS?
MarketClub looks at technical strength and momentum to determine if the timing is right for BRBS.
Learn more about the Trade Triangles and how we make technical analysis as easy as buy and sell.
|
|||||||||||||||
|
|||||||||||||||
MarketClub’s Trade Triangles for BRBS
![]() The long-term trend has been DOWN since Feb 27th, 2026 at 4.040
The long-term trend has been DOWN since Feb 27th, 2026 at 4.040
![]() The intermediate-term trend has been UP since Mar 23rd, 2026 at 4.110
The intermediate-term trend has been UP since Mar 23rd, 2026 at 4.110
![]() The short-term trend has been UP since Apr 8th, 2026 at 4.215
The short-term trend has been UP since Apr 8th, 2026 at 4.215
Smart Scan Analysis for BRBS
Based on our trend formula, BRBS is rated as a +60 on a scale from -100 (Strong Downtrend) to +100 (Strong Uptrend).
| Open | High | Low | Price | Change |
|---|---|---|---|---|
| 4.25 | 4.26 | 4.16 | 4.18 | -0.05 |
| Prev. Close | Volume | Bid | Ask | Time |
| 4.18 | 2226079 | 2026-04-10 15:59:43 |
| 52wk High | 4.785 | 52wk High Date | 2025-11-04 |
| 52wk Low | 3.02 | 52wk Low Date | 2025-04-10 |
| Average Volume | 460,760 | Shares Outstanding | 91,340 |
| Assets | 243,258,900M | Liabilities | 210,889,800M |
| P/E Ratio | 38.4545 |