Stock Trend Analysis Report
Prepared for you on Tuesday, April 7, 2026.
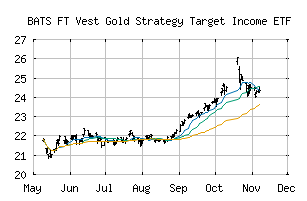
FT Vest Gold Strategy Target Income ETF (BATS:IGLD)
Countertrend Down (-85) - IGLD is showing short-term strength. However, look for the longer-term bearish trend to resume. As always, continue to monitor the trend score and set stops.
Is it time to buy, sell, or avoid IGLD?
MarketClub looks at technical strength and momentum to determine if the timing is right for IGLD.
Learn more about the Trade Triangles and how we make technical analysis as easy as buy and sell.
|
|||||||||||||||
|
|||||||||||||||
MarketClub’s Trade Triangles for IGLD
![]() The long-term trend has been DOWN since Mar 20th, 2026 at 24.6800
The long-term trend has been DOWN since Mar 20th, 2026 at 24.6800
![]() The intermediate-term trend has been DOWN since Mar 16th, 2026 at 27.0953
The intermediate-term trend has been DOWN since Mar 16th, 2026 at 27.0953
![]() The short-term trend has been UP since Mar 31st, 2026 at 24.9100
The short-term trend has been UP since Mar 31st, 2026 at 24.9100
Smart Scan Analysis for IGLD
Based on our trend formula, IGLD is rated as a -85 on a scale from -100 (Strong Downtrend) to +100 (Strong Uptrend).
| Open | High | Low | Price | Change |
|---|---|---|---|---|
| 25.0100 | 25.0799 | 24.8300 | 24.8400 | -0.1400 |
| Prev. Close | Volume | Bid | Ask | Time |
| 24.8400 | 238919 | 2026-04-06 15:59:51 |
| 52wk High | 30.42 | 52wk High Date | 2026-01-29 |
| 52wk Low | 19.7001 | 52wk Low Date | 2025-04-07 |
| Average Volume | 317,735 |