Stock Trend Analysis Report
Prepared for you on Sunday, April 12, 2026.
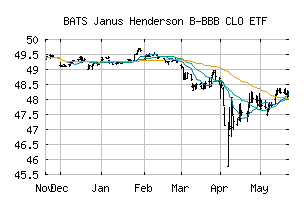
Janus Henderson B-BBB CLO ETF (BATS:JBBB)
Countertrend Down (-85) - JBBB is showing short-term strength. However, look for the longer-term bearish trend to resume. As always, continue to monitor the trend score and set stops.
Is it time to buy, sell, or avoid JBBB?
MarketClub looks at technical strength and momentum to determine if the timing is right for JBBB.
Learn more about the Trade Triangles and how we make technical analysis as easy as buy and sell.
|
|||||||||||||||
|
|||||||||||||||
MarketClub’s Trade Triangles for JBBB
![]() The long-term trend has been DOWN since Feb 19th, 2026 at 47.530
The long-term trend has been DOWN since Feb 19th, 2026 at 47.530
![]() The intermediate-term trend has been DOWN since Feb 4th, 2026 at 47.839
The intermediate-term trend has been DOWN since Feb 4th, 2026 at 47.839
![]() The short-term trend has been UP since Apr 8th, 2026 at 46.945
The short-term trend has been UP since Apr 8th, 2026 at 46.945
Smart Scan Analysis for JBBB
Based on our trend formula, JBBB is rated as a -85 on a scale from -100 (Strong Downtrend) to +100 (Strong Uptrend).
| Open | High | Low | Price | Change |
|---|---|---|---|---|
| 46.950 | 46.950 | 46.795 | 46.800 | -0.040 |
| Prev. Close | Volume | Bid | Ask | Time |
| 46.800 | 171924 | 2026-04-10 15:59:00 |