Stock Trend Analysis Report
Prepared for you on Sunday, March 8, 2026.
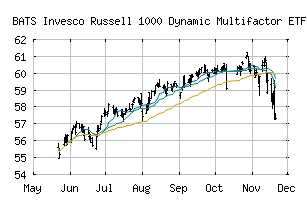
Invesco Russell 1000 Dynamic Multifactor ETF (BATS:OMFL)
Weak Downtrend (-65) - OMFL is showing signs of a strengthening downtrend. Monitor OMFL as it may be building momentum to the downside.
Is it time to buy, sell, or avoid OMFL?
MarketClub looks at technical strength and momentum to determine if the timing is right for OMFL.
Learn more about the Trade Triangles and how we make technical analysis as easy as buy and sell.
|
|||||||||||||||
|
|||||||||||||||
MarketClub’s Trade Triangles for OMFL
![]() The long-term trend has been UP since Dec 4th, 2025 at 61.21
The long-term trend has been UP since Dec 4th, 2025 at 61.21
![]() The intermediate-term trend has been DOWN since Mar 3rd, 2026 at 61.80
The intermediate-term trend has been DOWN since Mar 3rd, 2026 at 61.80
![]() The short-term trend has been DOWN since Mar 2nd, 2026 at 62.64
The short-term trend has been DOWN since Mar 2nd, 2026 at 62.64
Smart Scan Analysis for OMFL
Based on our trend formula, OMFL is rated as a -70 on a scale from -100 (Strong Downtrend) to +100 (Strong Uptrend).
| Open | High | Low | Price | Change |
|---|---|---|---|---|
| 61.460 | 61.680 | 61.110 | 61.285 | -1.015 |
| Prev. Close | Volume | Bid | Ask | Time |
| 61.280 | 254105 | 2026-03-06 15:59:46 |
| Year High | 29.2066 | Year High Date | 2018-09-21 |
| Year Low | 24.7399 | Year Low Date | 2018-02-09 |
| 52wk High | 63.99 | 52wk High Date | 2026-02-11 |
| 52wk Low | 47 | 52wk Low Date | 2025-04-07 |
| Average Volume | 351,399 | Volatility | 15.71 |