Stock Trend Analysis Report
Prepared for you on Saturday, December 13, 2025.
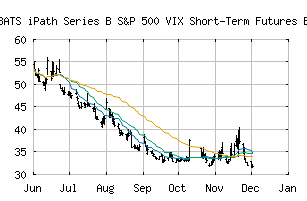
iPath Series B S&P 500 VIX Short-Term Futures ETN (BATS:VXX)
Countertrend Down (-85) - VXX is showing short-term strength. However, look for the longer-term bearish trend to resume. As always, continue to monitor the trend score and set stops.
Is it time to buy, sell, or avoid VXX?
MarketClub looks at technical strength and momentum to determine if the timing is right for VXX.
Learn more about the Trade Triangles and how we make technical analysis as easy as buy and sell.
|
|||||||||||||||
|
|||||||||||||||
MarketClub’s Trade Triangles for VXX
![]() The long-term trend has been DOWN since Jul 1st, 2025 at 47.61
The long-term trend has been DOWN since Jul 1st, 2025 at 47.61
![]() The intermediate-term trend has been DOWN since Nov 28th, 2025 at 32.50
The intermediate-term trend has been DOWN since Nov 28th, 2025 at 32.50
![]() The short-term trend has been UP since Dec 10th, 2025 at 31.52
The short-term trend has been UP since Dec 10th, 2025 at 31.52
Smart Scan Analysis for VXX
Based on our trend formula, VXX is rated as a -85 on a scale from -100 (Strong Downtrend) to +100 (Strong Uptrend).
| Open | High | Low | Price | Change |
|---|---|---|---|---|
| 29.35 | 30.90 | 29.11 | 29.57 | +0.09 |
| Prev. Close | Volume | Bid | Ask | Time |
| 29.53 | 11960966 | 2025-12-12 15:59:40 |
| 52wk High | 91.19 | 52wk High Date | 2025-04-08 |
| 52wk Low | 29.46 | 52wk Low Date | 2025-12-11 |
| Average Volume | 10,041,485 |