Index Trend Analysis Report
Prepared for you on Friday, July 26, 2024.
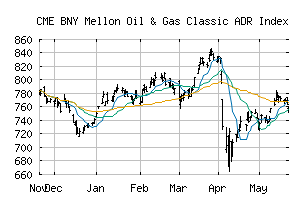
BNY Mellon Oil & Gas Classic ADR Index (CME:BKCOG)
Countertrend Down (-85) - BKCOG is showing short-term strength. However, look for the longer-term bearish trend to resume. As always, continue to monitor the trend score and set stops.
Is it time to buy, sell, or avoid BKCOG?
MarketClub looks at technical strength and momentum to determine if the timing is right for BKCOG.
Learn more about the Trade Triangles and how we make technical analysis as easy as buy and sell.
|
|||||||||||||||
|
|||||||||||||||
MarketClub’s Trade Triangles for BKCOG
![]() The long-term trend has been DOWN since Jun 14th, 2024 at 849.07
The long-term trend has been DOWN since Jun 14th, 2024 at 849.07
![]() The intermediate-term trend has been DOWN since Jul 23rd, 2024 at 875.56
The intermediate-term trend has been DOWN since Jul 23rd, 2024 at 875.56
![]() The short-term trend has been UP since Jul 26th, 2024 at 873.65
The short-term trend has been UP since Jul 26th, 2024 at 873.65
Smart Scan Analysis for BKCOG
Based on our trend formula, BKCOG is rated as a -85 on a scale from -100 (Strong Downtrend) to +100 (Strong Uptrend).
| Open | High | Low | Price | Change |
|---|---|---|---|---|
| 869.62 | 875.58 | 867.42 | 872.40 | +3.17 |
| Prev. Close | Volume | Bid | Ask | Time |
| 869.23 | 0 | 2024-07-26 16:20:03 |
| 52wk High | 1105.36 | 52wk High Date | 2018-05-17 |
| 52wk Low | 917.38 | 52wk Low Date | 2018-02-09 |