Index Trend Analysis Report
Prepared for you on Sunday, May 5, 2024.
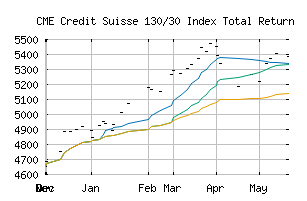
Credit Suisse 130/30 Index Total Return (CME:CS13030T)
Weak Downtrend (-65) - CS13030T is showing signs of a strengthening downtrend. Monitor CS13030T as it may be building momentum to the downside.
Is it time to buy, sell, or avoid CS13030T?
MarketClub looks at technical strength and momentum to determine if the timing is right for CS13030T.
Learn more about the Trade Triangles and how we make technical analysis as easy as buy and sell.
|
|||||||||||||||
|
|||||||||||||||
MarketClub’s Trade Triangles for CS13030T
![]() The long-term trend has been UP since Nov 22nd, 2023 at 4623.83
The long-term trend has been UP since Nov 22nd, 2023 at 4623.83
![]() The intermediate-term trend has been DOWN since Apr 17th, 2024 at 5337.03
The intermediate-term trend has been DOWN since Apr 17th, 2024 at 5337.03
![]() The short-term trend has been DOWN since Apr 2nd, 2024 at 5421.69
The short-term trend has been DOWN since Apr 2nd, 2024 at 5421.69
Smart Scan Analysis for CS13030T
Based on our trend formula, CS13030T is rated as a -70 on a scale from -100 (Strong Downtrend) to +100 (Strong Uptrend).
| Open | High | Low | Price | Change |
|---|---|---|---|---|
| 5222.86 | 5222.86 | 5222.86 | 5222.86 | +42.25 |
| Prev. Close | Volume | Bid | Ask | Time |
| 5280.68 | 0 | 2024-05-02 17:53:30 |
| 52wk High | 2923.52 | 52wk High Date | 2018-09-21 |
| 52wk Low | 2555.24 | 52wk Low Date | 2018-02-08 |