Index Trend Analysis Report
Prepared for you on Wednesday, July 30, 2025.
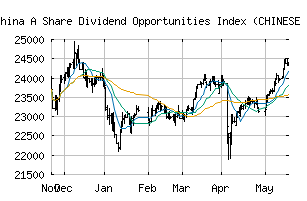
S&P China A Share Dividend Opportunities Index (CHINESE RENMINBI) (TR) (CME:CSPSADRT)
Bull Market Weakness (+75) - CSPSADRT is showing signs of short-term weakness, but still remains in the confines of a long-term uptrend. Keep an eye on CSPSADRT as it may be in the beginning stages of a reversal.
Is it time to buy, sell, or avoid CSPSADRT?
MarketClub looks at technical strength and momentum to determine if the timing is right for CSPSADRT.
Learn more about the Trade Triangles and how we make technical analysis as easy as buy and sell.
|
|||||||||||||||
|
|||||||||||||||
MarketClub’s Trade Triangles for CSPSADRT
![]() The long-term trend has been UP since May 14th, 2025 at 24104.52
The long-term trend has been UP since May 14th, 2025 at 24104.52
![]() The intermediate-term trend has been UP since May 6th, 2025 at 23523.50
The intermediate-term trend has been UP since May 6th, 2025 at 23523.50
![]() The short-term trend has been DOWN since Jul 27th, 2025 at 26109.65
The short-term trend has been DOWN since Jul 27th, 2025 at 26109.65
Smart Scan Analysis for CSPSADRT
Based on our trend formula, CSPSADRT is rated as a +75 on a scale from -100 (Strong Downtrend) to +100 (Strong Uptrend).
| Open | High | Low | Price | Change |
|---|---|---|---|---|
| 26111.47 | 26137.15 | 25903.14 | 26028.85 | -83.76 |
| Prev. Close | Volume | Bid | Ask | Time |
| 26112.61 | 0 | 2025-07-30 03:30:01 |