Index Trend Analysis Report
Prepared for you on Tuesday, April 23, 2024.
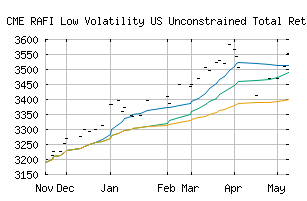
RAFI Low Volatility US Unconstrained Total Return (CME:RALVUSLT)
Crossroads (-60) - RALVUSLT is struggling to move into a solid trend. Beware of choppy markets and consider a sidelines position until a stronger trend is identified.
Is it time to buy, sell, or avoid RALVUSLT?
MarketClub looks at technical strength and momentum to determine if the timing is right for RALVUSLT.
Learn more about the Trade Triangles and how we make technical analysis as easy as buy and sell.
|
|||||||||||||||
|
|||||||||||||||
MarketClub’s Trade Triangles for RALVUSLT
![]() The long-term trend has been UP since Dec 1st, 2023 at 3252.94
The long-term trend has been UP since Dec 1st, 2023 at 3252.94
![]() The intermediate-term trend has been DOWN since Apr 17th, 2024 at 3507.50
The intermediate-term trend has been DOWN since Apr 17th, 2024 at 3507.50
![]() The short-term trend has been DOWN since Apr 4th, 2024 at 3544.71
The short-term trend has been DOWN since Apr 4th, 2024 at 3544.71
Smart Scan Analysis for RALVUSLT
Based on our trend formula, RALVUSLT is rated as a -60 on a scale from -100 (Strong Downtrend) to +100 (Strong Uptrend).
| Open | High | Low | Price | Change |
|---|---|---|---|---|
| 3414.23 | 3414.23 | 3414.23 | 3414.23 | +10.28 |
| Prev. Close | Volume | Bid | Ask | Time |
| 3480.84 | 0 | 2024-04-17 17:37:18 |
| 52wk High | 2302.58 | 52wk High Date | 2018-11-09 |
| 52wk Low | 1983.02 | 52wk Low Date | 2018-03-23 |