Index Trend Analysis Report
Prepared for you on Thursday, February 19, 2026.
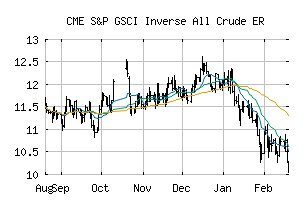
S&P GSCI Inverse All Crude ER (CME:SG1ICRP)
Long-Term Downtrend (-90) - SG1ICRP is in a strong downtrend that is likely to continue. While SG1ICRP is showing intraday strength, it remains in the confines of a bearish trend. Traders should use caution and set stops.
Is it time to buy, sell, or avoid SG1ICRP?
MarketClub looks at technical strength and momentum to determine if the timing is right for SG1ICRP.
Learn more about the Trade Triangles and how we make technical analysis as easy as buy and sell.
|
|||||||||||||||
|
|||||||||||||||
MarketClub’s Trade Triangles for SG1ICRP
![]() The long-term trend has been DOWN since Jan 13th, 2026 at 11.303
The long-term trend has been DOWN since Jan 13th, 2026 at 11.303
![]() The intermediate-term trend has been DOWN since Jan 6th, 2026 at 11.819
The intermediate-term trend has been DOWN since Jan 6th, 2026 at 11.819
![]() The short-term trend has been DOWN since Feb 18th, 2026 at 10.520
The short-term trend has been DOWN since Feb 18th, 2026 at 10.520
Smart Scan Analysis for SG1ICRP
Based on our trend formula, SG1ICRP is rated as a -90 on a scale from -100 (Strong Downtrend) to +100 (Strong Uptrend).
| Open | High | Low | Price | Change |
|---|---|---|---|---|
| 10.277 | 10.295 | 10.047 | 10.088 | -0.177 |
| Prev. Close | Volume | Bid | Ask | Time |
| 10.265 | 0 | 2026-02-19 19:21:56 |