Index Trend Analysis Report
Prepared for you on Thursday, March 26, 2026.
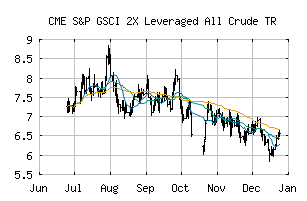
S&P GSCI 2X Leveraged All Crude TR (CME:SG2LCRTR)
Countertrend Up (+85) - SG2LCRTR is showing short-term weakness. However, look for the longer-term bullish trend to resume. As always, continue to monitor the trend score and utilize a stop order.
Is it time to buy, sell, or avoid SG2LCRTR?
MarketClub looks at technical strength and momentum to determine if the timing is right for SG2LCRTR.
Learn more about the Trade Triangles and how we make technical analysis as easy as buy and sell.
|
|||||||||||||||
|
|||||||||||||||
MarketClub’s Trade Triangles for SG2LCRTR
![]() The long-term trend has been UP since Jan 14th, 2026 at 7.4166
The long-term trend has been UP since Jan 14th, 2026 at 7.4166
![]() The intermediate-term trend has been UP since Jan 6th, 2026 at 6.6501
The intermediate-term trend has been UP since Jan 6th, 2026 at 6.6501
![]() The short-term trend has been DOWN since Mar 23rd, 2026 at 17.3976
The short-term trend has been DOWN since Mar 23rd, 2026 at 17.3976
Smart Scan Analysis for SG2LCRTR
Based on our trend formula, SG2LCRTR is rated as a +85 on a scale from -100 (Strong Downtrend) to +100 (Strong Uptrend).
| Open | High | Low | Price | Change |
|---|---|---|---|---|
| 16.6916 | 17.9456 | 16.6121 | 17.7694 | +1.0693 |
| Prev. Close | Volume | Bid | Ask | Time |
| 16.7001 | 0 | 2026-03-26 12:49:46 |