Index Trend Analysis Report
Prepared for you on Saturday, April 18, 2026.
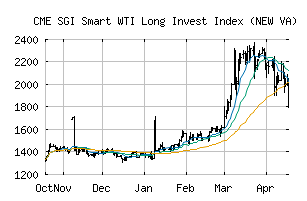
SGI Smart WTI Long Invest Index (NEW VA) (CME:SGIXWTIL)
Long-Term Downtrend (-90) - SGIXWTIL is in a strong downtrend that is likely to continue. While SGIXWTIL is showing intraday strength, it remains in the confines of a bearish trend. Traders should use caution and set stops.
Is it time to buy, sell, or avoid SGIXWTIL?
MarketClub looks at technical strength and momentum to determine if the timing is right for SGIXWTIL.
Learn more about the Trade Triangles and how we make technical analysis as easy as buy and sell.
|
|||||||||||||||
|
|||||||||||||||
MarketClub’s Trade Triangles for SGIXWTIL
![]() The long-term trend has been DOWN since Mar 26th, 2026 at 1308.450
The long-term trend has been DOWN since Mar 26th, 2026 at 1308.450
![]() The intermediate-term trend has been DOWN since Mar 26th, 2026 at 1620.780
The intermediate-term trend has been DOWN since Mar 26th, 2026 at 1620.780
![]() The short-term trend has been DOWN since Apr 14th, 2026 at 2021.966
The short-term trend has been DOWN since Apr 14th, 2026 at 2021.966
Smart Scan Analysis for SGIXWTIL
Based on our trend formula, SGIXWTIL is rated as a -90 on a scale from -100 (Strong Downtrend) to +100 (Strong Uptrend).
| Open | High | Low | Price | Change |
|---|---|---|---|---|
| 2040.432 | 2052.702 | 1797.989 | 1891.376 | -152.237 |
| Prev. Close | Volume | Bid | Ask | Time |
| 1876.607 | 0 | 2026-04-17 14:45:00 |
| 52wk High | 1461.033 | 52wk High Date | 2018-10-03 |
| 52wk Low | 984.634 | 52wk Low Date | 2018-11-29 |