Index Trend Analysis Report
Prepared for you on Friday, April 26, 2024.
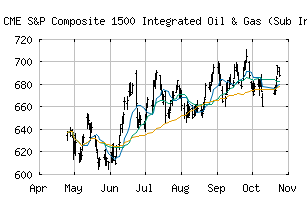
S&P Composite 1500 Integrated Oil & Gas (Sub Ind) (CME:SP1500-10102010)
Strong Uptrend (+100) - SP1500-10102010 is in a strong uptrend that is likely to continue. With short-term, intermediate, and long-term bullish momentum, SP1500-10102010 continues to climb. Traders should protect gains and look for a change in score to suggest a slow down in momentum.
Is it time to buy, sell, or avoid SP1500-10102010?
MarketClub looks at technical strength and momentum to determine if the timing is right for SP1500-10102010.
Learn more about the Trade Triangles and how we make technical analysis as easy as buy and sell.
|
|||||||||||||||
|
|||||||||||||||
MarketClub’s Trade Triangles for SP1500-10102010
![]() The long-term trend has been UP since Mar 1st, 2024 at 663.89
The long-term trend has been UP since Mar 1st, 2024 at 663.89
![]() The intermediate-term trend has been UP since Jan 29th, 2024 at 642.41
The intermediate-term trend has been UP since Jan 29th, 2024 at 642.41
![]() The short-term trend has been UP since Apr 19th, 2024 at 723.65
The short-term trend has been UP since Apr 19th, 2024 at 723.65
Smart Scan Analysis for SP1500-10102010
Based on our trend formula, SP1500-10102010 is rated as a +100 on a scale from -100 (Strong Downtrend) to +100 (Strong Uptrend).
| Open | High | Low | Price | Change |
|---|---|---|---|---|
| 737.12 | 741.22 | 728.01 | 739.55 | +4.04 |
| Prev. Close | Volume | Bid | Ask | Time |
| 739.55 | 30877452 | 2024-04-25 16:19:57 |
| 52wk High | 579.74 | 52wk High Date | 2018-01-24 |
| 52wk Low | 475.2 | 52wk Low Date | 2018-04-02 |