Index Trend Analysis Report
Prepared for you on Tuesday, July 1, 2025.
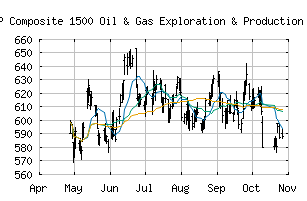
S&P Composite 1500 Oil & Gas Exploration & Production (Sub Ind) (CME:SP1500-10102020)
Weak Downtrend (-65) - SP1500-10102020 is showing signs of a strengthening downtrend. Monitor SP1500-10102020 as it may be building momentum to the downside.
Is it time to buy, sell, or avoid SP1500-10102020?
MarketClub looks at technical strength and momentum to determine if the timing is right for SP1500-10102020.
Learn more about the Trade Triangles and how we make technical analysis as easy as buy and sell.
|
|||||||||||||||
|
|||||||||||||||
MarketClub’s Trade Triangles for SP1500-10102020
![]() The long-term trend has been DOWN since Mar 4th, 2025 at 599.93
The long-term trend has been DOWN since Mar 4th, 2025 at 599.93
![]() The intermediate-term trend has been UP since Apr 28th, 2025 at 598.77
The intermediate-term trend has been UP since Apr 28th, 2025 at 598.77
![]() The short-term trend has been DOWN since Jun 23rd, 2025 at 638.58
The short-term trend has been DOWN since Jun 23rd, 2025 at 638.58
Smart Scan Analysis for SP1500-10102020
Based on our trend formula, SP1500-10102020 is rated as a -65 on a scale from -100 (Strong Downtrend) to +100 (Strong Uptrend).
| Open | High | Low | Price | Change |
|---|---|---|---|---|
| 609.62 | 609.89 | 602.99 | 608.84 | -1.37 |
| Prev. Close | Volume | Bid | Ask | Time |
| 610.21 | 27311147 | 2025-07-01 11:08:57 |
| 52wk High | 557.14 | 52wk High Date | 2018-10-09 |
| 52wk Low | 402.71 | 52wk Low Date | 2018-02-09 |