Index Trend Analysis Report
Prepared for you on Monday, March 30, 2026.
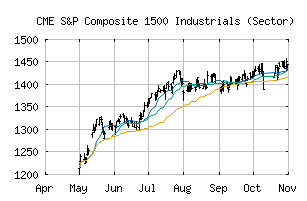
S&P Composite 1500 Industrials (Sector) (CME:SP1500-20)
Weak Downtrend (-65) - SP1500-20 is showing signs of a strengthening downtrend. Monitor SP1500-20 as it may be building momentum to the downside.
Is it time to buy, sell, or avoid SP1500-20?
MarketClub looks at technical strength and momentum to determine if the timing is right for SP1500-20.
Learn more about the Trade Triangles and how we make technical analysis as easy as buy and sell.
|
|||||||||||||||
|
|||||||||||||||
MarketClub’s Trade Triangles for SP1500-20
![]() The long-term trend has been UP since Dec 11th, 2025 at 1456.99
The long-term trend has been UP since Dec 11th, 2025 at 1456.99
![]() The intermediate-term trend has been DOWN since Mar 3rd, 2026 at 1604.57
The intermediate-term trend has been DOWN since Mar 3rd, 2026 at 1604.57
![]() The short-term trend has been DOWN since Mar 27th, 2026 at 1494.95
The short-term trend has been DOWN since Mar 27th, 2026 at 1494.95
Smart Scan Analysis for SP1500-20
Based on our trend formula, SP1500-20 is rated as a -70 on a scale from -100 (Strong Downtrend) to +100 (Strong Uptrend).
| Open | High | Low | Price | Change |
|---|---|---|---|---|
| 1489.96 | 1491.30 | 1448.67 | 1453.59 | -24.68 |
| Prev. Close | Volume | Bid | Ask | Time |
| 1478.27 | 508198888 | 2026-03-30 16:20:04 |
| 52wk High | 727.84 | 52wk High Date | 2018-01-29 |
| 52wk Low | 604.88 | 52wk Low Date | 2018-10-29 |