Index Trend Analysis Report
Prepared for you on Wednesday, July 30, 2025.
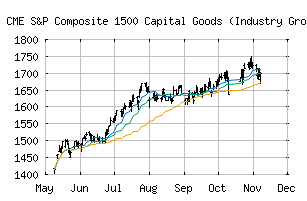
S&P Composite 1500 Capital Goods (Industry Group) (CME:SP1500-2010)
Bull Market Weakness (+75) - SP1500-2010 is showing signs of short-term weakness, but still remains in the confines of a long-term uptrend. Keep an eye on SP1500-2010 as it may be in the beginning stages of a reversal.
Is it time to buy, sell, or avoid SP1500-2010?
MarketClub looks at technical strength and momentum to determine if the timing is right for SP1500-2010.
Learn more about the Trade Triangles and how we make technical analysis as easy as buy and sell.
|
|||||||||||||||
|
|||||||||||||||
MarketClub’s Trade Triangles for SP1500-2010
![]() The long-term trend has been UP since May 12th, 2025 at 1447.16
The long-term trend has been UP since May 12th, 2025 at 1447.16
![]() The intermediate-term trend has been UP since Apr 28th, 2025 at 1336.83
The intermediate-term trend has been UP since Apr 28th, 2025 at 1336.83
![]() The short-term trend has been DOWN since Jul 30th, 2025 at 1646.84
The short-term trend has been DOWN since Jul 30th, 2025 at 1646.84
Smart Scan Analysis for SP1500-2010
Based on our trend formula, SP1500-2010 is rated as a +75 on a scale from -100 (Strong Downtrend) to +100 (Strong Uptrend).
| Open | High | Low | Price | Change |
|---|---|---|---|---|
| 1652.30 | 1656.65 | 1639.26 | 1647.50 | -3.81 |
| Prev. Close | Volume | Bid | Ask | Time |
| 1651.31 | 291263898 | 2025-07-30 16:14:57 |
| 52wk High | 788.09 | 52wk High Date | 2018-01-29 |
| 52wk Low | 631.26 | 52wk Low Date | 2018-10-29 |