Index Trend Analysis Report
Prepared for you on Thursday, March 12, 2026.
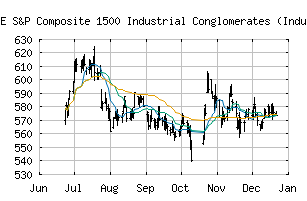
S&P Composite 1500 Industrial Conglomerates (Industry) (CME:SP1500-201050)
Weak Downtrend (-65) - SP1500-201050 is showing signs of a strengthening downtrend. Monitor SP1500-201050 as it may be building momentum to the downside.
Is it time to buy, sell, or avoid SP1500-201050?
MarketClub looks at technical strength and momentum to determine if the timing is right for SP1500-201050.
Learn more about the Trade Triangles and how we make technical analysis as easy as buy and sell.
|
|||||||||||||||
|
|||||||||||||||
MarketClub’s Trade Triangles for SP1500-201050
![]() The long-term trend has been UP since Jan 13th, 2026 at 606.09
The long-term trend has been UP since Jan 13th, 2026 at 606.09
![]() The intermediate-term trend has been DOWN since Mar 2nd, 2026 at 646.91
The intermediate-term trend has been DOWN since Mar 2nd, 2026 at 646.91
![]() The short-term trend has been DOWN since Feb 26th, 2026 at 651.77
The short-term trend has been DOWN since Feb 26th, 2026 at 651.77
Smart Scan Analysis for SP1500-201050
Based on our trend formula, SP1500-201050 is rated as a -70 on a scale from -100 (Strong Downtrend) to +100 (Strong Uptrend).
| Open | High | Low | Price | Change |
|---|---|---|---|---|
| 635.34 | 638.78 | 629.39 | 635.25 | -2.12 |
| Prev. Close | Volume | Bid | Ask | Time |
| 635.25 | 6688008 | 2026-03-11 16:18:57 |
| 52wk High | 401.25 | 52wk High Date | 2018-01-12 |
| 52wk Low | 282.31 | 52wk Low Date | 2018-11-26 |