Index Trend Analysis Report
Prepared for you on Tuesday, March 3, 2026.
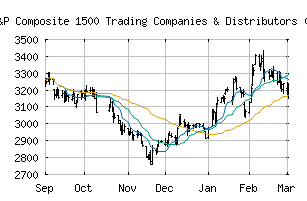
S&P Composite 1500 Trading Companies & Distributors (Industry) (CME:SP1500-201070)
Sidelines Mode (+55) - SP1500-201070 is moving in a sideways pattern and is unable to gain momentum in either direction. Beware of choppy movement and consider a sidelines position until a stronger trend is identified.
Is it time to buy, sell, or avoid SP1500-201070?
MarketClub looks at technical strength and momentum to determine if the timing is right for SP1500-201070.
Learn more about the Trade Triangles and how we make technical analysis as easy as buy and sell.
|
|||||||||||||||
|
|||||||||||||||
MarketClub’s Trade Triangles for SP1500-201070
![]() The long-term trend has been UP since Jan 21st, 2026 at 3227.67
The long-term trend has been UP since Jan 21st, 2026 at 3227.67
![]() The intermediate-term trend has been DOWN since Mar 2nd, 2026 at 3177.11
The intermediate-term trend has been DOWN since Mar 2nd, 2026 at 3177.11
![]() The short-term trend has been UP since Feb 20th, 2026 at 3321.04
The short-term trend has been UP since Feb 20th, 2026 at 3321.04
Smart Scan Analysis for SP1500-201070
Based on our trend formula, SP1500-201070 is rated as a +55 on a scale from -100 (Strong Downtrend) to +100 (Strong Uptrend).
| Open | High | Low | Price | Change |
|---|---|---|---|---|
| 3195.21 | 3214.13 | 3148.45 | 3213.08 | -24.93 |
| Prev. Close | Volume | Bid | Ask | Time |
| 3238.01 | 8371875 | 2026-03-03 13:13:12 |
| 52wk High | 1019.22 | 52wk High Date | 2018-09-21 |
| 52wk Low | 775.52 | 52wk Low Date | 2018-10-26 |