Index Trend Analysis Report
Prepared for you on Wednesday, July 30, 2025.
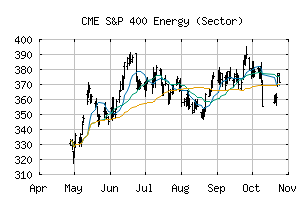
S&P 400 Energy (Sector) (CME:SP400-10)
Sidelines Mode (-55) - SP400-10 is moving in a sideways pattern and is unable to gain momentum in either direction. Beware of choppy movement and consider a sidelines position until a stronger trend is identified.
Is it time to buy, sell, or avoid SP400-10?
MarketClub looks at technical strength and momentum to determine if the timing is right for SP400-10.
Learn more about the Trade Triangles and how we make technical analysis as easy as buy and sell.
|
|||||||||||||||
|
|||||||||||||||
MarketClub’s Trade Triangles for SP400-10
![]() The long-term trend has been DOWN since Mar 3rd, 2025 at 355.90
The long-term trend has been DOWN since Mar 3rd, 2025 at 355.90
![]() The intermediate-term trend has been DOWN since Jul 21st, 2025 at 362.17
The intermediate-term trend has been DOWN since Jul 21st, 2025 at 362.17
![]() The short-term trend has been UP since Jul 25th, 2025 at 369.22
The short-term trend has been UP since Jul 25th, 2025 at 369.22
Smart Scan Analysis for SP400-10
Based on our trend formula, SP400-10 is rated as a -55 on a scale from -100 (Strong Downtrend) to +100 (Strong Uptrend).
| Open | High | Low | Price | Change |
|---|---|---|---|---|
| 372.55 | 375.42 | 369.72 | 373.97 | +0.96 |
| Prev. Close | Volume | Bid | Ask | Time |
| 373.97 | 54982630 | 2025-07-29 16:17:49 |
| 52wk High | 530.69 | 52wk High Date | 2018-10-09 |
| 52wk Low | 345.5 | 52wk Low Date | 2018-02-09 |