Index Trend Analysis Report
Prepared for you on Friday, July 26, 2024.
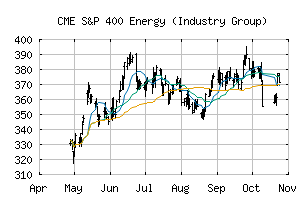
S&P 400 Energy (Industry Group) (CME:SP400-1010)
Weak Downtrend (-65) - SP400-1010 is showing signs of a strengthening downtrend. Monitor SP400-1010 as it may be building momentum to the downside.
Is it time to buy, sell, or avoid SP400-1010?
MarketClub looks at technical strength and momentum to determine if the timing is right for SP400-1010.
Learn more about the Trade Triangles and how we make technical analysis as easy as buy and sell.
|
|||||||||||||||
|
|||||||||||||||
MarketClub’s Trade Triangles for SP400-1010
![]() The long-term trend has been UP since Mar 1st, 2024 at 358.42
The long-term trend has been UP since Mar 1st, 2024 at 358.42
![]() The intermediate-term trend has been DOWN since Jul 25th, 2024 at 369.70
The intermediate-term trend has been DOWN since Jul 25th, 2024 at 369.70
![]() The short-term trend has been DOWN since Jul 18th, 2024 at 382.93
The short-term trend has been DOWN since Jul 18th, 2024 at 382.93
Smart Scan Analysis for SP400-1010
Based on our trend formula, SP400-1010 is rated as a -70 on a scale from -100 (Strong Downtrend) to +100 (Strong Uptrend).
| Open | High | Low | Price | Change |
|---|---|---|---|---|
| 372.45 | 376.06 | 369.56 | 374.86 | +3.39 |
| Prev. Close | Volume | Bid | Ask | Time |
| 371.47 | 104464452 | 2024-07-26 16:20:05 |
| 52wk High | 530.67 | 52wk High Date | 2018-10-09 |
| 52wk Low | 345.53 | 52wk Low Date | 2018-02-09 |