Index Trend Analysis Report
Prepared for you on Thursday, March 26, 2026.
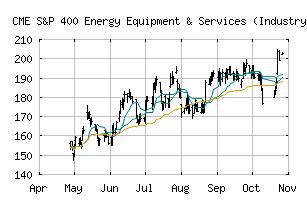
S&P 400 Energy Equipment & Services (Industry) (CME:SP400-101010)
Strong Uptrend (+100) - SP400-101010 is in a strong uptrend that is likely to continue. With short-term, intermediate, and long-term bullish momentum, SP400-101010 continues to climb. Traders should protect gains and look for a change in score to suggest a slow down in momentum.
Is it time to buy, sell, or avoid SP400-101010?
MarketClub looks at technical strength and momentum to determine if the timing is right for SP400-101010.
Learn more about the Trade Triangles and how we make technical analysis as easy as buy and sell.
|
|||||||||||||||
|
|||||||||||||||
MarketClub’s Trade Triangles for SP400-101010
![]() The long-term trend has been UP since Jul 28th, 2025 at 193.54
The long-term trend has been UP since Jul 28th, 2025 at 193.54
![]() The intermediate-term trend has been UP since Mar 25th, 2026 at 325.99
The intermediate-term trend has been UP since Mar 25th, 2026 at 325.99
![]() The short-term trend has been UP since Mar 17th, 2026 at 302.72
The short-term trend has been UP since Mar 17th, 2026 at 302.72
Smart Scan Analysis for SP400-101010
Based on our trend formula, SP400-101010 is rated as a +100 on a scale from -100 (Strong Downtrend) to +100 (Strong Uptrend).
| Open | High | Low | Price | Change |
|---|---|---|---|---|
| 327.79 | 330.86 | 326.78 | 329.60 | +0.08 |
| Prev. Close | Volume | Bid | Ask | Time |
| 329.52 | 1937836 | 2026-03-26 11:48:05 |
| 52wk High | 674.84 | 52wk High Date | 2018-05-17 |
| 52wk Low | 415.42 | 52wk Low Date | 2018-11-28 |