Index Trend Analysis Report
Prepared for you on Sunday, February 22, 2026.
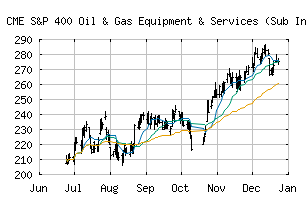
S&P 400 Oil & Gas Equipment & Services (Sub Ind) (CME:SP400-10101020)
Strong Uptrend (+100) - SP400-10101020 is in a strong uptrend that is likely to continue. With short-term, intermediate, and long-term bullish momentum, SP400-10101020 continues to climb. Traders should protect gains and look for a change in score to suggest a slow down in momentum.
Is it time to buy, sell, or avoid SP400-10101020?
MarketClub looks at technical strength and momentum to determine if the timing is right for SP400-10101020.
Learn more about the Trade Triangles and how we make technical analysis as easy as buy and sell.
|
|||||||||||||||
|
|||||||||||||||
MarketClub’s Trade Triangles for SP400-10101020
![]() The long-term trend has been UP since Sep 3rd, 2025 at 241.73
The long-term trend has been UP since Sep 3rd, 2025 at 241.73
![]() The intermediate-term trend has been UP since Oct 23rd, 2025 at 242.19
The intermediate-term trend has been UP since Oct 23rd, 2025 at 242.19
![]() The short-term trend has been UP since Feb 18th, 2026 at 369.37
The short-term trend has been UP since Feb 18th, 2026 at 369.37
Smart Scan Analysis for SP400-10101020
Based on our trend formula, SP400-10101020 is rated as a +100 on a scale from -100 (Strong Downtrend) to +100 (Strong Uptrend).
| Open | High | Low | Price | Change |
|---|---|---|---|---|
| 368.40 | 376.33 | 365.23 | 376.32 | +6.26 |
| Prev. Close | Volume | Bid | Ask | Time |
| 376.32 | 12008027 | 2026-02-20 16:19:24 |
| 52wk High | 626.57 | 52wk High Date | 2018-05-22 |
| 52wk Low | 375.67 | 52wk Low Date | 2018-11-28 |