Index Trend Analysis Report
Prepared for you on Monday, April 6, 2026.
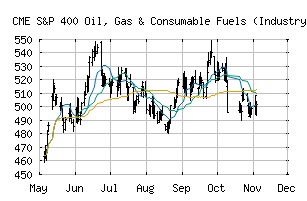
S&P 400 Oil, Gas & Consumable Fuels (Industry) (CME:SP400-101020)
Countertrend Up (+85) - SP400-101020 is showing short-term weakness. However, look for the longer-term bullish trend to resume. As always, continue to monitor the trend score and utilize a stop order.
Is it time to buy, sell, or avoid SP400-101020?
MarketClub looks at technical strength and momentum to determine if the timing is right for SP400-101020.
Learn more about the Trade Triangles and how we make technical analysis as easy as buy and sell.
|
|||||||||||||||
|
|||||||||||||||
MarketClub’s Trade Triangles for SP400-101020
![]() The long-term trend has been UP since Jun 16th, 2025 at 541.97
The long-term trend has been UP since Jun 16th, 2025 at 541.97
![]() The intermediate-term trend has been UP since Jan 14th, 2026 at 530.37
The intermediate-term trend has been UP since Jan 14th, 2026 at 530.37
![]() The short-term trend has been DOWN since Mar 31st, 2026 at 699.74
The short-term trend has been DOWN since Mar 31st, 2026 at 699.74
Smart Scan Analysis for SP400-101020
Based on our trend formula, SP400-101020 is rated as a +85 on a scale from -100 (Strong Downtrend) to +100 (Strong Uptrend).
| Open | High | Low | Price | Change |
|---|---|---|---|---|
| 679.76 | 685.03 | 676.68 | 682.66 | +2.03 |
| Prev. Close | Volume | Bid | Ask | Time |
| 680.63 | 31918177 | 2026-04-06 16:19:39 |
| 52wk High | 567.08 | 52wk High Date | 2018-10-09 |
| 52wk Low | 346.69 | 52wk Low Date | 2018-02-09 |