Index Trend Analysis Report
Prepared for you on Wednesday, March 25, 2026.
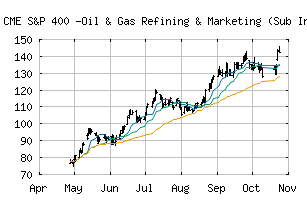
S&P 400 -Oil & Gas Refining & Marketing (Sub Ind) (CME:SP400-10102030)
Long-Term Uptrend (+90) - SP400-10102030 is in a strong uptrend that is likely to continue. While SP400-10102030 is showing intraday weakness, it remains in the confines of a bullish trend. Traders should use caution and utilize a stop order.
Is it time to buy, sell, or avoid SP400-10102030?
MarketClub looks at technical strength and momentum to determine if the timing is right for SP400-10102030.
Learn more about the Trade Triangles and how we make technical analysis as easy as buy and sell.
|
|||||||||||||||
|
|||||||||||||||
MarketClub’s Trade Triangles for SP400-10102030
![]() The long-term trend has been UP since Feb 6th, 2026 at 152.49
The long-term trend has been UP since Feb 6th, 2026 at 152.49
![]() The intermediate-term trend has been UP since Mar 4th, 2026 at 156.08
The intermediate-term trend has been UP since Mar 4th, 2026 at 156.08
![]() The short-term trend has been UP since Mar 24th, 2026 at 174.19
The short-term trend has been UP since Mar 24th, 2026 at 174.19
Smart Scan Analysis for SP400-10102030
Based on our trend formula, SP400-10102030 is rated as a +90 on a scale from -100 (Strong Downtrend) to +100 (Strong Uptrend).
| Open | High | Low | Price | Change |
|---|---|---|---|---|
| 169.64 | 173.79 | 168.30 | 170.84 | -1.83 |
| Prev. Close | Volume | Bid | Ask | Time |
| 172.67 | 5992225 | 2026-03-25 16:19:20 |
| 52wk High | 211.66 | 52wk High Date | 2018-10-04 |
| 52wk Low | 113.18 | 52wk Low Date | 2018-03-01 |