Index Trend Analysis Report
Prepared for you on Thursday, July 31, 2025.
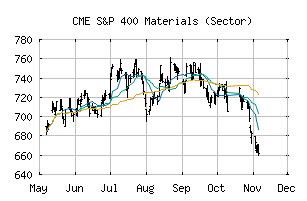
S&P 400 Materials (Sector) (CME:SP400-15)
Sidelines Mode (+55) - SP400-15 is moving in a sideways pattern and is unable to gain momentum in either direction. Beware of choppy movement and consider a sidelines position until a stronger trend is identified.
Is it time to buy, sell, or avoid SP400-15?
MarketClub looks at technical strength and momentum to determine if the timing is right for SP400-15.
Learn more about the Trade Triangles and how we make technical analysis as easy as buy and sell.
|
|||||||||||||||
|
|||||||||||||||
MarketClub’s Trade Triangles for SP400-15
![]() The long-term trend has been UP since Jul 1st, 2025 at 727.40
The long-term trend has been UP since Jul 1st, 2025 at 727.40
![]() The intermediate-term trend has been UP since Apr 28th, 2025 at 686.97
The intermediate-term trend has been UP since Apr 28th, 2025 at 686.97
![]() The short-term trend has been DOWN since Jul 28th, 2025 at 741.47
The short-term trend has been DOWN since Jul 28th, 2025 at 741.47
Smart Scan Analysis for SP400-15
Based on our trend formula, SP400-15 is rated as a +55 on a scale from -100 (Strong Downtrend) to +100 (Strong Uptrend).
| Open | High | Low | Price | Change |
|---|---|---|---|---|
| 734.91 | 735.01 | 723.10 | 725.86 | -10.61 |
| Prev. Close | Volume | Bid | Ask | Time |
| 725.86 | 67161547 | 2025-07-30 16:19:59 |
| 52wk High | 545.11 | 52wk High Date | 2018-01-26 |
| 52wk Low | 424.19 | 52wk Low Date | 2018-10-29 |