Index Trend Analysis Report
Prepared for you on Thursday, May 8, 2025.
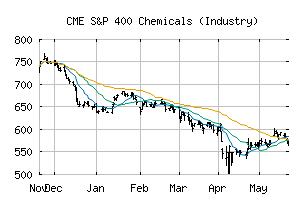
S&P 400 Chemicals (Industry) (CME:SP400-151010)
Sidelines Mode (-55) - SP400-151010 is moving in a sideways pattern and is unable to gain momentum in either direction. Beware of choppy movement and consider a sidelines position until a stronger trend is identified.
Is it time to buy, sell, or avoid SP400-151010?
MarketClub looks at technical strength and momentum to determine if the timing is right for SP400-151010.
Learn more about the Trade Triangles and how we make technical analysis as easy as buy and sell.
|
|||||||||||||||
|
|||||||||||||||
MarketClub’s Trade Triangles for SP400-151010
![]() The long-term trend has been DOWN since Jan 2nd, 2025 at 644.80
The long-term trend has been DOWN since Jan 2nd, 2025 at 644.80
![]() The intermediate-term trend has been UP since May 2nd, 2025 at 579.78
The intermediate-term trend has been UP since May 2nd, 2025 at 579.78
![]() The short-term trend has been DOWN since May 6th, 2025 at 564.95
The short-term trend has been DOWN since May 6th, 2025 at 564.95
Smart Scan Analysis for SP400-151010
Based on our trend formula, SP400-151010 is rated as a -55 on a scale from -100 (Strong Downtrend) to +100 (Strong Uptrend).
| Open | High | Low | Price | Change |
|---|---|---|---|---|
| 566.76 | 576.52 | 564.26 | 571.52 | +8.82 |
| Prev. Close | Volume | Bid | Ask | Time |
| 562.70 | 11827698 | 2025-05-08 17:58:16 |
| 52wk High | 640.44 | 52wk High Date | 2018-01-25 |
| 52wk Low | 481.44 | 52wk Low Date | 2018-10-26 |