Index Trend Analysis Report
Prepared for you on Monday, April 20, 2026.
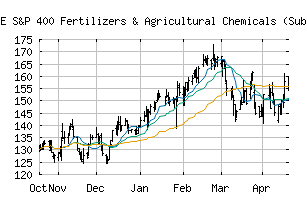
S&P 400 Fertilizers & Agricultural Chemicals (Sub Ind) (CME:SP400-15101030)
Bull Market Weakness (+75) - SP400-15101030 is showing signs of short-term weakness, but still remains in the confines of a long-term uptrend. Keep an eye on SP400-15101030 as it may be in the beginning stages of a reversal.
Is it time to buy, sell, or avoid SP400-15101030?
MarketClub looks at technical strength and momentum to determine if the timing is right for SP400-15101030.
Learn more about the Trade Triangles and how we make technical analysis as easy as buy and sell.
|
|||||||||||||||
|
|||||||||||||||
MarketClub’s Trade Triangles for SP400-15101030
![]() The long-term trend has been UP since Jan 5th, 2026 at 143.83
The long-term trend has been UP since Jan 5th, 2026 at 143.83
![]() The intermediate-term trend has been DOWN since Mar 6th, 2026 at 156.58
The intermediate-term trend has been DOWN since Mar 6th, 2026 at 156.58
![]() The short-term trend has been UP since Apr 16th, 2026 at 149.97
The short-term trend has been UP since Apr 16th, 2026 at 149.97
Smart Scan Analysis for SP400-15101030
Based on our trend formula, SP400-15101030 is rated as a +75 on a scale from -100 (Strong Downtrend) to +100 (Strong Uptrend).
| Open | High | Low | Price | Change |
|---|---|---|---|---|
| 155.94 | 159.33 | 154.34 | 158.67 | +0.91 |
| Prev. Close | Volume | Bid | Ask | Time |
| 157.76 | 328334 | 2026-04-20 15:09:35 |
| 52wk High | 255.54 | 52wk High Date | 2018-01-12 |
| 52wk Low | 151.58 | 52wk Low Date | 2018-10-29 |