Index Trend Analysis Report
Prepared for you on Saturday, May 4, 2024.
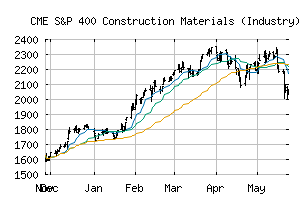
S&P 400 Construction Materials (Industry) (CME:SP400-151020)
Weak Uptrend (+65) - SP400-151020 is showing signs of weakening momentum to the upside. Monitor SP400-151020 as it may be in the beginning stages of a reversal.
Is it time to buy, sell, or avoid SP400-151020?
MarketClub looks at technical strength and momentum to determine if the timing is right for SP400-151020.
Learn more about the Trade Triangles and how we make technical analysis as easy as buy and sell.
|
|||||||||||||||
|
|||||||||||||||
MarketClub’s Trade Triangles for SP400-151020
![]() The long-term trend has been UP since Dec 1st, 2023 at 1646.63
The long-term trend has been UP since Dec 1st, 2023 at 1646.63
![]() The intermediate-term trend has been DOWN since Apr 16th, 2024 at 2208.16
The intermediate-term trend has been DOWN since Apr 16th, 2024 at 2208.16
![]() The short-term trend has been UP since May 3rd, 2024 at 2255.46
The short-term trend has been UP since May 3rd, 2024 at 2255.46
Smart Scan Analysis for SP400-151020
Based on our trend formula, SP400-151020 is rated as a +65 on a scale from -100 (Strong Downtrend) to +100 (Strong Uptrend).
| Open | High | Low | Price | Change |
|---|---|---|---|---|
| 2275.57 | 2298.01 | 2257.63 | 2262.84 | +24.36 |
| Prev. Close | Volume | Bid | Ask | Time |
| 2262.84 | 794397 | 2024-05-03 16:19:35 |
| 52wk High | 971.83 | 52wk High Date | 2018-01-16 |
| 52wk Low | 515.51 | 52wk Low Date | 2018-10-29 |