Index Trend Analysis Report
Prepared for you on Thursday, December 26, 2024.
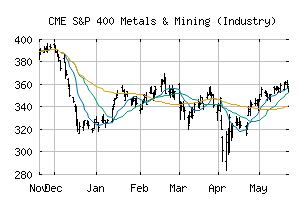
S&P 400 Metals & Mining (Industry) (CME:SP400-151040)
Crossroads (-60) - SP400-151040 is struggling to move into a solid trend. Beware of choppy markets and consider a sidelines position until a stronger trend is identified.
Is it time to buy, sell, or avoid SP400-151040?
MarketClub looks at technical strength and momentum to determine if the timing is right for SP400-151040.
Learn more about the Trade Triangles and how we make technical analysis as easy as buy and sell.
|
|||||||||||||||
|
|||||||||||||||
MarketClub’s Trade Triangles for SP400-151040
![]() The long-term trend has been UP since Oct 18th, 2024 at 376.72
The long-term trend has been UP since Oct 18th, 2024 at 376.72
![]() The intermediate-term trend has been DOWN since Dec 10th, 2024 at 370.92
The intermediate-term trend has been DOWN since Dec 10th, 2024 at 370.92
![]() The short-term trend has been DOWN since Dec 4th, 2024 at 388.65
The short-term trend has been DOWN since Dec 4th, 2024 at 388.65
Smart Scan Analysis for SP400-151040
Based on our trend formula, SP400-151040 is rated as a -60 on a scale from -100 (Strong Downtrend) to +100 (Strong Uptrend).
| Open | High | Low | Price | Change |
|---|---|---|---|---|
| 326.88 | 327.83 | 323.51 | 327.60 | +2.37 |
| Prev. Close | Volume | Bid | Ask | Time |
| 327.60 | 13346975 | 2024-12-24 13:19:54 |
| 52wk High | 249.55 | 52wk High Date | 2018-05-31 |
| 52wk Low | 177.2 | 52wk Low Date | 2018-11-28 |