Index Trend Analysis Report
Prepared for you on Wednesday, March 25, 2026.
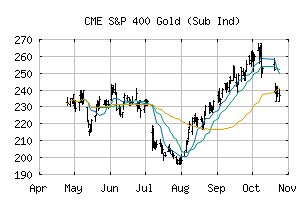
S&P 400 Gold (Sub Ind) (CME:SP400-15104030)
Crossroads (-60) - SP400-15104030 is struggling to move into a solid trend. Beware of choppy markets and consider a sidelines position until a stronger trend is identified.
Is it time to buy, sell, or avoid SP400-15104030?
MarketClub looks at technical strength and momentum to determine if the timing is right for SP400-15104030.
Learn more about the Trade Triangles and how we make technical analysis as easy as buy and sell.
|
|||||||||||||||
|
|||||||||||||||
MarketClub’s Trade Triangles for SP400-15104030
![]() The long-term trend has been UP since Sep 8th, 2025 at 243.66
The long-term trend has been UP since Sep 8th, 2025 at 243.66
![]() The intermediate-term trend has been DOWN since Mar 5th, 2026 at 348.02
The intermediate-term trend has been DOWN since Mar 5th, 2026 at 348.02
![]() The short-term trend has been DOWN since Mar 13th, 2026 at 350.03
The short-term trend has been DOWN since Mar 13th, 2026 at 350.03
Smart Scan Analysis for SP400-15104030
Based on our trend formula, SP400-15104030 is rated as a -60 on a scale from -100 (Strong Downtrend) to +100 (Strong Uptrend).
| Open | High | Low | Price | Change |
|---|---|---|---|---|
| 281.82 | 295.39 | 281.82 | 295.30 | +5.90 |
| Prev. Close | Volume | Bid | Ask | Time |
| 295.30 | 1343503 | 2026-03-24 16:19:35 |
| 52wk High | 125.84 | 52wk High Date | 2018-07-05 |
| 52wk Low | 91.12 | 52wk Low Date | 2018-11-13 |