Index Trend Analysis Report
Prepared for you on Thursday, July 31, 2025.
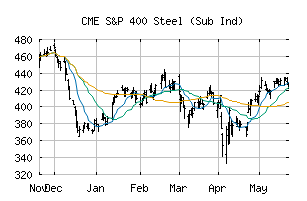
S&P 400 Steel (Sub Ind) (CME:SP400-15104050)
Weak Downtrend (-65) - SP400-15104050 is showing signs of a strengthening downtrend. Monitor SP400-15104050 as it may be building momentum to the downside.
Is it time to buy, sell, or avoid SP400-15104050?
MarketClub looks at technical strength and momentum to determine if the timing is right for SP400-15104050.
Learn more about the Trade Triangles and how we make technical analysis as easy as buy and sell.
|
|||||||||||||||
|
|||||||||||||||
MarketClub’s Trade Triangles for SP400-15104050
![]() The long-term trend has been UP since May 23rd, 2025 at 444.11
The long-term trend has been UP since May 23rd, 2025 at 444.11
![]() The intermediate-term trend has been DOWN since Jul 29th, 2025 at 503.70
The intermediate-term trend has been DOWN since Jul 29th, 2025 at 503.70
![]() The short-term trend has been DOWN since Jul 24th, 2025 at 532.01
The short-term trend has been DOWN since Jul 24th, 2025 at 532.01
Smart Scan Analysis for SP400-15104050
Based on our trend formula, SP400-15104050 is rated as a -70 on a scale from -100 (Strong Downtrend) to +100 (Strong Uptrend).
| Open | High | Low | Price | Change |
|---|---|---|---|---|
| 506.17 | 512.97 | 504.19 | 506.98 | -0.32 |
| Prev. Close | Volume | Bid | Ask | Time |
| 506.98 | 24339146 | 2025-07-30 16:20:09 |
| 52wk High | 255.45 | 52wk High Date | 2018-02-20 |
| 52wk Low | 175.34 | 52wk Low Date | 2018-11-28 |