Index Trend Analysis Report
Prepared for you on Tuesday, July 1, 2025.
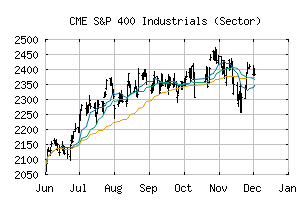
S&P 400 Industrials (Sector) (CME:SP400-20)
Long-Term Uptrend (+90) - SP400-20 is in a strong uptrend that is likely to continue. While SP400-20 is showing intraday weakness, it remains in the confines of a bullish trend. Traders should use caution and utilize a stop order.
Is it time to buy, sell, or avoid SP400-20?
MarketClub looks at technical strength and momentum to determine if the timing is right for SP400-20.
Learn more about the Trade Triangles and how we make technical analysis as easy as buy and sell.
|
|||||||||||||||
|
|||||||||||||||
MarketClub’s Trade Triangles for SP400-20
![]() The long-term trend has been UP since Jun 24th, 2025 at 2174.86
The long-term trend has been UP since Jun 24th, 2025 at 2174.86
![]() The intermediate-term trend has been UP since Jun 24th, 2025 at 2171.15
The intermediate-term trend has been UP since Jun 24th, 2025 at 2171.15
![]() The short-term trend has been UP since Jun 24th, 2025 at 2149.15
The short-term trend has been UP since Jun 24th, 2025 at 2149.15
Smart Scan Analysis for SP400-20
Based on our trend formula, SP400-20 is rated as a +90 on a scale from -100 (Strong Downtrend) to +100 (Strong Uptrend).
| Open | High | Low | Price | Change |
|---|---|---|---|---|
| 2206.78 | 2207.23 | 2191.54 | 2200.01 | -4.29 |
| Prev. Close | Volume | Bid | Ask | Time |
| 2200.01 | 121734356 | 2025-06-30 16:20:04 |
| 52wk High | 1086.19 | 52wk High Date | 2018-09-21 |
| 52wk Low | 888.84 | 52wk Low Date | 2018-10-29 |