Index Trend Analysis Report
Prepared for you on Wednesday, July 30, 2025.
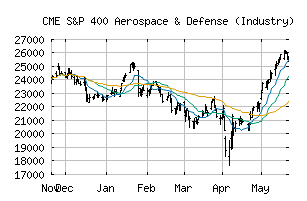
S&P 400 Aerospace & Defense (Industry) (CME:SP400-201010)
Strong Uptrend (+100) - SP400-201010 is in a strong uptrend that is likely to continue. With short-term, intermediate, and long-term bullish momentum, SP400-201010 continues to climb. Traders should protect gains and look for a change in score to suggest a slow down in momentum.
Is it time to buy, sell, or avoid SP400-201010?
MarketClub looks at technical strength and momentum to determine if the timing is right for SP400-201010.
Learn more about the Trade Triangles and how we make technical analysis as easy as buy and sell.
|
|||||||||||||||
|
|||||||||||||||
MarketClub’s Trade Triangles for SP400-201010
![]() The long-term trend has been UP since May 5th, 2025 at 23908.22
The long-term trend has been UP since May 5th, 2025 at 23908.22
![]() The intermediate-term trend has been UP since Apr 28th, 2025 at 22010.20
The intermediate-term trend has been UP since Apr 28th, 2025 at 22010.20
![]() The short-term trend has been UP since Jul 24th, 2025 at 31591.36
The short-term trend has been UP since Jul 24th, 2025 at 31591.36
Smart Scan Analysis for SP400-201010
Based on our trend formula, SP400-201010 is rated as a +100 on a scale from -100 (Strong Downtrend) to +100 (Strong Uptrend).
| Open | High | Low | Price | Change |
|---|---|---|---|---|
| 31948.42 | 32333.78 | 31855.01 | 32184.77 | +236.53 |
| Prev. Close | Volume | Bid | Ask | Time |
| 31948.24 | 7130371 | 2025-07-30 16:19:50 |
| 52wk High | 7855.65 | 52wk High Date | 2018-09-19 |
| 52wk Low | 6220.44 | 52wk Low Date | 2018-02-09 |