Index Trend Analysis Report
Prepared for you on Sunday, April 28, 2024.
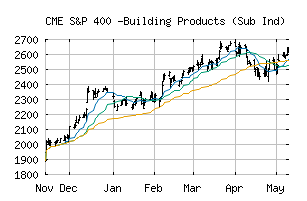
S&P 400 -Building Products (Sub Ind) (CME:SP400-20102010)
Weak Uptrend (+65) - SP400-20102010 is showing signs of weakening momentum to the upside. Monitor SP400-20102010 as it may be in the beginning stages of a reversal.
Is it time to buy, sell, or avoid SP400-20102010?
MarketClub looks at technical strength and momentum to determine if the timing is right for SP400-20102010.
Learn more about the Trade Triangles and how we make technical analysis as easy as buy and sell.
|
|||||||||||||||
|
|||||||||||||||
MarketClub’s Trade Triangles for SP400-20102010
![]() The long-term trend has been UP since Dec 1st, 2023 at 2107.03
The long-term trend has been UP since Dec 1st, 2023 at 2107.03
![]() The intermediate-term trend has been DOWN since Apr 12th, 2024 at 2525.97
The intermediate-term trend has been DOWN since Apr 12th, 2024 at 2525.97
![]() The short-term trend has been UP since Apr 26th, 2024 at 2552.10
The short-term trend has been UP since Apr 26th, 2024 at 2552.10
Smart Scan Analysis for SP400-20102010
Based on our trend formula, SP400-20102010 is rated as a +65 on a scale from -100 (Strong Downtrend) to +100 (Strong Uptrend).
| Open | High | Low | Price | Change |
|---|---|---|---|---|
| 2505.80 | 2566.34 | 2505.80 | 2548.14 | +48.05 |
| Prev. Close | Volume | Bid | Ask | Time |
| 2548.14 | 3914337 | 2024-04-26 16:19:50 |
| 52wk High | 894.18 | 52wk High Date | 2018-09-13 |
| 52wk Low | 689.6 | 52wk Low Date | 2018-10-22 |