Index Trend Analysis Report
Prepared for you on Wednesday, July 2, 2025.
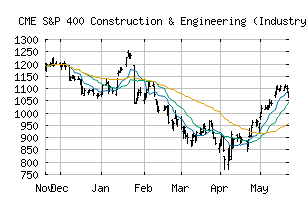
S&P 400 Construction & Engineering (Industry) (CME:SP400-201030)
Long-Term Uptrend (+90) - SP400-201030 is in a strong uptrend that is likely to continue. While SP400-201030 is showing intraday weakness, it remains in the confines of a bullish trend. Traders should use caution and utilize a stop order.
Is it time to buy, sell, or avoid SP400-201030?
MarketClub looks at technical strength and momentum to determine if the timing is right for SP400-201030.
Learn more about the Trade Triangles and how we make technical analysis as easy as buy and sell.
|
|||||||||||||||
|
|||||||||||||||
MarketClub’s Trade Triangles for SP400-201030
![]() The long-term trend has been UP since Jun 3rd, 2025 at 1132.14
The long-term trend has been UP since Jun 3rd, 2025 at 1132.14
![]() The intermediate-term trend has been UP since Apr 23rd, 2025 at 923.72
The intermediate-term trend has been UP since Apr 23rd, 2025 at 923.72
![]() The short-term trend has been UP since Jun 24th, 2025 at 1186.99
The short-term trend has been UP since Jun 24th, 2025 at 1186.99
Smart Scan Analysis for SP400-201030
Based on our trend formula, SP400-201030 is rated as a +90 on a scale from -100 (Strong Downtrend) to +100 (Strong Uptrend).
| Open | High | Low | Price | Change |
|---|---|---|---|---|
| 1221.79 | 1227.37 | 1196.21 | 1216.33 | -12.99 |
| Prev. Close | Volume | Bid | Ask | Time |
| 1216.33 | 10924308 | 2025-07-01 16:20:05 |
| 52wk High | 434.22 | 52wk High Date | 2018-01-24 |
| 52wk Low | 307.33 | 52wk Low Date | 2018-10-24 |