Index Trend Analysis Report
Prepared for you on Saturday, December 13, 2025.
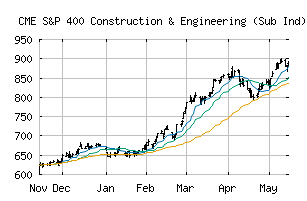
S&P 400 Construction & Engineering (Sub Ind) (CME:SP400-20103010)
Countertrend Up (+85) - SP400-20103010 is showing short-term weakness. However, look for the longer-term bullish trend to resume. As always, continue to monitor the trend score and utilize a stop order.
Is it time to buy, sell, or avoid SP400-20103010?
MarketClub looks at technical strength and momentum to determine if the timing is right for SP400-20103010.
Learn more about the Trade Triangles and how we make technical analysis as easy as buy and sell.
|
|||||||||||||||
|
|||||||||||||||
MarketClub’s Trade Triangles for SP400-20103010
![]() The long-term trend has been UP since Jun 3rd, 2025 at 1132.14
The long-term trend has been UP since Jun 3rd, 2025 at 1132.14
![]() The intermediate-term trend has been UP since Dec 8th, 2025 at 1569.02
The intermediate-term trend has been UP since Dec 8th, 2025 at 1569.02
![]() The short-term trend has been DOWN since Dec 12th, 2025 at 1524.02
The short-term trend has been DOWN since Dec 12th, 2025 at 1524.02
Smart Scan Analysis for SP400-20103010
Based on our trend formula, SP400-20103010 is rated as a +85 on a scale from -100 (Strong Downtrend) to +100 (Strong Uptrend).
| Open | High | Low | Price | Change |
|---|---|---|---|---|
| 1592.35 | 1592.35 | 1486.19 | 1527.88 | -65.92 |
| Prev. Close | Volume | Bid | Ask | Time |
| 1527.88 | 7502306 | 2025-12-12 16:52:59 |
| 52wk High | 434.22 | 52wk High Date | 2018-01-24 |
| 52wk Low | 307.33 | 52wk Low Date | 2018-10-24 |