Index Trend Analysis Report
Prepared for you on Tuesday, March 3, 2026.
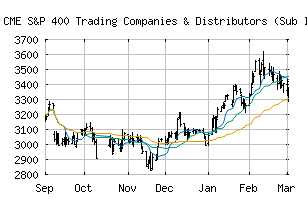
S&P 400 Trading Companies & Distributors (Sub Ind) (CME:SP400-20107010)
Crossroads (-60) - SP400-20107010 is struggling to move into a solid trend. Beware of choppy markets and consider a sidelines position until a stronger trend is identified.
Is it time to buy, sell, or avoid SP400-20107010?
MarketClub looks at technical strength and momentum to determine if the timing is right for SP400-20107010.
Learn more about the Trade Triangles and how we make technical analysis as easy as buy and sell.
|
|||||||||||||||
|
|||||||||||||||
MarketClub’s Trade Triangles for SP400-20107010
![]() The long-term trend has been UP since Jan 9th, 2026 at 3214.09
The long-term trend has been UP since Jan 9th, 2026 at 3214.09
![]() The intermediate-term trend has been DOWN since Mar 2nd, 2026 at 3348.98
The intermediate-term trend has been DOWN since Mar 2nd, 2026 at 3348.98
![]() The short-term trend has been DOWN since Feb 19th, 2026 at 3437.10
The short-term trend has been DOWN since Feb 19th, 2026 at 3437.10
Smart Scan Analysis for SP400-20107010
Based on our trend formula, SP400-20107010 is rated as a -60 on a scale from -100 (Strong Downtrend) to +100 (Strong Uptrend).
| Open | High | Low | Price | Change |
|---|---|---|---|---|
| 3335.07 | 3378.02 | 3285.22 | 3369.25 | -53.79 |
| Prev. Close | Volume | Bid | Ask | Time |
| 3423.04 | 3304689 | 2026-03-03 16:19:54 |
| 52wk High | 1494.17 | 52wk High Date | 2018-09-19 |
| 52wk Low | 1204.45 | 52wk Low Date | 2018-10-29 |