Index Trend Analysis Report
Prepared for you on Thursday, November 14, 2024.
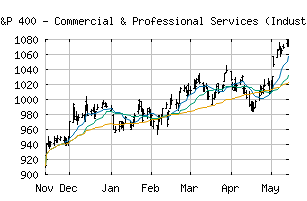
S&P 400 - Commercial & Professional Services (Industry Group) (CME:SP400-2020)
Weak Downtrend (-65) - SP400-2020 is showing signs of a strengthening downtrend. Monitor SP400-2020 as it may be building momentum to the downside.
Is it time to buy, sell, or avoid SP400-2020?
MarketClub looks at technical strength and momentum to determine if the timing is right for SP400-2020.
Learn more about the Trade Triangles and how we make technical analysis as easy as buy and sell.
|
|||||||||||||||
|
|||||||||||||||
MarketClub’s Trade Triangles for SP400-2020
![]() The long-term trend has been UP since Dec 4th, 2023 at 984.41
The long-term trend has been UP since Dec 4th, 2023 at 984.41
![]() The intermediate-term trend has been DOWN since Nov 14th, 2024 at 1140.25
The intermediate-term trend has been DOWN since Nov 14th, 2024 at 1140.25
![]() The short-term trend has been DOWN since Nov 13th, 2024 at 1201.86
The short-term trend has been DOWN since Nov 13th, 2024 at 1201.86
Smart Scan Analysis for SP400-2020
Based on our trend formula, SP400-2020 is rated as a -70 on a scale from -100 (Strong Downtrend) to +100 (Strong Uptrend).
| Open | High | Low | Price | Change |
|---|---|---|---|---|
| 1187.66 | 1190.18 | 1131.08 | 1132.08 | -67.27 |
| Prev. Close | Volume | Bid | Ask | Time |
| 1199.35 | 29321962 | 2024-11-14 16:56:55 |
| 52wk High | 788.54 | 52wk High Date | 2018-08-27 |
| 52wk Low | 680.46 | 52wk Low Date | 2018-02-09 |