Index Trend Analysis Report
Prepared for you on Sunday, March 29, 2026.
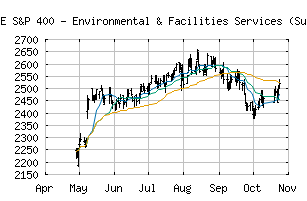
S&P 400 - Environmental & Facilities Services (Sub Ind) (CME:SP400-20201050)
Weak Downtrend (-65) - SP400-20201050 is showing signs of a strengthening downtrend. Monitor SP400-20201050 as it may be building momentum to the downside.
Is it time to buy, sell, or avoid SP400-20201050?
MarketClub looks at technical strength and momentum to determine if the timing is right for SP400-20201050.
Learn more about the Trade Triangles and how we make technical analysis as easy as buy and sell.
|
|||||||||||||||
|
|||||||||||||||
MarketClub’s Trade Triangles for SP400-20201050
![]() The long-term trend has been UP since Jan 5th, 2026 at 2537.92
The long-term trend has been UP since Jan 5th, 2026 at 2537.92
![]() The intermediate-term trend has been DOWN since Mar 13th, 2026 at 2694.88
The intermediate-term trend has been DOWN since Mar 13th, 2026 at 2694.88
![]() The short-term trend has been DOWN since Mar 27th, 2026 at 2635.19
The short-term trend has been DOWN since Mar 27th, 2026 at 2635.19
Smart Scan Analysis for SP400-20201050
Based on our trend formula, SP400-20201050 is rated as a -70 on a scale from -100 (Strong Downtrend) to +100 (Strong Uptrend).
| Open | High | Low | Price | Change |
|---|---|---|---|---|
| 2623.87 | 2636.96 | 2592.04 | 2596.43 | -42.63 |
| Prev. Close | Volume | Bid | Ask | Time |
| 2596.43 | 3409504 | 2026-03-27 16:34:13 |
| 52wk High | 1290.65 | 52wk High Date | 2018-09-18 |
| 52wk Low | 884.81 | 52wk Low Date | 2018-02-09 |